-
Mini-Lesson
OVERVIEW
 A scientist will use many different resources when researching a subject. In many cases, a scientist will read texts on the Internet to get the most up-to-date information. Today children learn strategies to use when looking for specific information on the Internet.
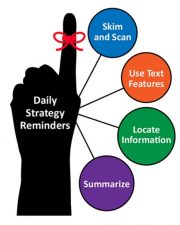
Note: You are encouraged to create a “Reading for Specific Information on the Internet” anchor chart with your learners as you move through the lesson, using the provided anchor chart as a model. Post it for easy reference when completed and remind learners to refer to the anchor charts during inquiry circles.
Materials for the Mini-Lesson:
Teacher needs:
- chart paper
- marker(s)
- “Reading for Specific Information on the Internet” anchor chart to model the strategy
- class Inquiry Chart (pond ecosystem)
- website about pond ecosystems
PROCEDURE
Each italicized statement below contains suggested wording the teacher may use for the lesson; additional teacher actions and considerations are in parentheses.
EXPLAIN THE STRATEGY
Tell what the strategy is (declarative knowledge)
- Our strategy today is called “reading for specific information on the Internet.” While exploring my North American ecosystem, I will use many resources, such as books, videos, and websites.
Tell when and why to use the strategy (conditional knowledge)
- I know to use this strategy (reading for specific information on the Internet) because sometimes the books I have available may be outdated or simply do not include what I am looking for. When this happens, I can get more information on the Internet.
- As a strategic reader, I will scan the website because I do not need to read every word when I am looking for specific information. Just like when I scan a page in a book, this strategy is important because it saves me lots of time.
- As a strategic reader using the Internet, I will also be skeptical about what I read online and always use websites that I can trust. Therefore, I will only use a website that my teacher, parent, or guardian has approved. (Before allowing your learners online, you may want to ensure that the suggested websites are not blocked by your school district. You may also choose to bookmark the websites on your browser and/or create QR codes that learners can scan to go directly to the website. You may also want to use district-purchased websites. Many websites have text-to-speech options that may be used to scaffold for your learners.)
Tell how to use the strategy (procedural knowledge)
- The first thing I will do is think about what I need to research today.
- Now, I will look at my Inquiry Chart to determine what specific information I need to locate. Since we just started exploring ecosystems, I can choose any question on my Inquiry Chart to answer. In a couple of days, my Inquiry Chart will help me know what data is missing. (Using the class Inquiry Chart about a pond ecosystem, model how you would look at the missing parts on the chart to determine what to research. Alternatively, you may choose to assign specific questions to explore daily.)
- Then I think about a few key words I need to look for on the website. (Project for the class a chosen website about ponds that contains the missing information on the class Inquiry Chart.)
- When I am on a website, the first thing I do is check to see if I can believe what is on the website. Since I am only using websites that my teacher approved, I know I can trust the information. If I look for information at home, I will ask my parent or guardian for help in determining if a website is safe. I must remember to scan the entire page on the screen. Just like in a book, the text features are important and can lead me to valuable information. (Point out captions, bold words, subtitles, etc. on the webpage.)
- If I do not find the information I need, I should try another website.
- While scanning, I may see a hyperlink that I can click on for more information. If my mouse turns from an arrow to a hand, I know this is something I can click on. Sometimes the hyperlink will be words that are in color or bolded or underlined, and other times it may be a picture or icon. I may also see short videos to play.
- Sometimes websites have extra information that I should ignore. This could be advertisements, videos (not about my ecosystem), and even pop ups. I should ignore them.
- If I find myself on a website that is not useful, I can use the back button at the top of my browser to get back to the website where I started. (Alternatively, you could have websites bookmarked and have learners return to the correct place using the bookmark.)
- Once I find the specific information I need, I must remember to record it on the Inquiry Chart. This information includes the URL for the website I used. (Model for learners finding the information about the pond ecosystem on the website. You may also need to model where to find the URL on the webpage and where to record it on the Inquiry Chart.)
- This is a strategy I will use every time I read for specific information on a website.
- (You may have some teams working online while others are working in traditional texts.)
-
Inquiry Circles
OVERVIEW
Today, inquiry circles may use a different resource to add to a question they have already started to answer, or they may answer a completely different question.
Materials for the Inquiry Circles:
Each team needs:
- team Inquiry Chart
- pencils
- exploratory texts/media (see the “Ecosystem Resources” spreadsheet for ideas)
Teacher needs:
- class Inquiry Chart (pond ecosystem)
- exploratory text, website, or eBook about pond ecosystems to model the strategy
PROCEDURE
Each italicized statement below contains suggested wording the teacher may use for the lesson; additional teacher actions and considerations are in parentheses.
Before Inquiry Circles
- It is time to get into our inquiry circle teams. You will be with the same inquiry team as yesterday.
- Yesterday, we answered more of our Inquiry Chart questions. Some of you completed an entire column and others started to answer questions in more than one column. (This may or may not be true for your class. Please adjust as needed.) Today we will continue to answer more questions or use a different book, website, or eBook to add information to a question we’ve already answered. (Use a third resource about ponds to model on the class Inquiry Chart how to record the source in a new row. Be sure to use a variety of resources when modeling.)
- (Depending on your example, you may add additional information to the first question’s column, or you may be able to answer another question. Be sure to model this for your learners. To incorporate the mini-lesson from today, you can also model reading for specific information on the Internet or simply remind your class of the mini-lesson and use that information to complete the Inquiry Chart section.)
- Now, inquiry teams will work together on their Inquiry Chart. (Be sure to display the class Inquiry Chart as a model.)
During Inquiry Circles (20 minutes)
- Do not forget that it is important to record your resources on the Inquiry Chart as you complete it. (Remind learners that the class Inquiry Chart is visible as a guide. Also, you may choose to be more explicit for your class and only allow them to answer one question at a time daily. Use your judgement on the level of guidance.)
- As you read on the Internet, remember to scan for keys words to find specific information and to ignore extra information like pop-ups. (While teams are working together, walk around the room to facilitate as needed.)
- Remember, we have anchor charts to help guide your thinking. Do not forget to use them while in teams. (Refer to all the mini-lesson anchor charts used to date, which should be posted in the classroom where learners can easily refer to them.)
- My role is to help guide the inquiry circles, but I expect you to work as a team to solve your problems together. (While teams are working, walk around the room to facilitate as needed.)
After Inquiry Circles (10 minutes)
- As we conclude our inquiry circles for today, each team will have a chance to share the questions they answered, as well as what they accomplished and what literacy strategies they used. The Lab Director will lead the discussion about today’s results. What did the team learn about its ecosystem? Did the team read for specific information on the Internet? What problems did the team encounter? How did the team resolve those problems?
- The Data Scientist will now share with the entire class either something the team learned about their ecosystem, which reading strategy they used, or how the team solved a problem. (Try to encourage teams to share a variety of things. You do not want just facts about ecosystems, just reading strategies, or just cooperative learning strategies. If you saw a great example in action, encourage that team to share with the entire class.)
-
Guided Science Investigation
Learners should have their investigation questions selected by today. (Teacher may allow extra time for those who need it.) With their questions selected, learners decide what information will help them answer their questions and how they will collect this information.
GUIDING QUESTIONS
What information do I need to answer my question? How will I collect it? Where/how will I record it?
BACKGROUND INFORMATION FOR THE TEACHER
Scientists know that collecting information through observations and measurements may provide the evidence they need for making explanations and answering questions. Documenting the information they collect is important because the next step will be to make sense of it and determine if they have answered their questions or if they need to conduct more investigations.
Materials for the Guided Science Investigation:
Each team member needs:
- science notebook
- pencil
- 1 copy of “Data Log Example” sheet
Each team needs:
- 1 copy of the Team Data Log
- 1 “Shades of Green” color chart
Teacher needs:
- 1- or 2-liter containers of the green substance (dependent on the number of teams)
- small plastic bottles (2 per team) We suggest new and clean empty 236 mL (8 oz.) drinking water bottles with the caps. Alternatively, the bottles can be purchased from Algae Research Supply.
- 2 empty bottles to model with
- measuring cup
- funnel
- “Shades of Green” color chart
- “Data Log Example” sheet
- Team Data Log
SETUP
- Print color copies of the “Shades of Green” color chart (1 per team).
- Make copies of the blank Team Data Log (1 copy per team).
- Make copies of the “Data Log Example” sheet (1 copy per learner).
- Prepare 2 bottles for teacher demonstration with 88mL (3 oz.) each of the green substance. Use the funnel to pour the green substance.
- Display the large bottle of green substance and the empty small bottles where all can see.
SAFETY
There are no safety concerns today.
DAILY OBSERVATIONS
None at this time.
PROCEDURE
Engage:
- Begin with, Yesterday, each team selected a question about the green substance to investigate. Today you will need to decide what kind of information you need to collect to answer your questions and how you will record it. Remember that scientists always keep careful notes and organize their data (information) because they know how important it is to have evidence that supports their findings.
- Gather the class around the display of materials. Explain that each team will receive 2 bottles of the green substance for their investigation. Why two? Let’s revisit the question I came up with: Does light effect the color of the substance?
- Explain, All science investigations contain “” A scientific variable is something (a condition) that can change or potentially change in a science investigation. In my investigation, light is the variable or condition that will change.
- Emphasize that it is important to change only one variable at a time. Think, why would that be important? (So that we know exactly what is causing any change.)
- Explain that you will keep one bottle in the light and place the other bottle in a dark place with no light.
- Point out that the bottle that stays in the light is called the “control” because you will not change anything—it stays in the same light as before. A control is something that does not change throughout the course of the investigation.
- The other bottle will be placed in a location with no light (inside a cabinet or closet). Now, the variable (light) has been changed.
- I predict that the color of the sample in the dark will not be as green as the one in the light because it is not receiving any light energy.
- Let the class know that you will need to have evidence from the investigation to support the answer to your question “Does light affect the color?” The evidence will come from the data you collect.
- Ask the class, “What kind of information will I need to answer my question?” (Observations, photos, measurements?) Where will I record my information? How often? (Every day.)
- How will I know if there is a color change? Accept all responses.
- At this point, ask Equipment Directors to hand out the “Data Log Example” sheets (1 per learner) and 1 copy of the blank Team Data Log and the “Shades of Green” color chart for the team. Show them the “Shades of Green” color chart and sample data sheet that you will use.
- Read aloud to the class as they follow along, modeling how you will record information. I will compare the color in the bottles to the numbered color chart. Then I will write down the corresponding number under the date on my data sheet. In this way, I will be able to track any changes I observe! Ask if there are any questions.
Explore
- Direct their attention to the Team Data Log. Assign each team a number (1, 2, etc.) and ask each team’s Data Scientist to write it in the appropriate space on top. Let them know that their data log is bigger the “Data Log Example” sheet to allow for different types of data collected. (If teams will be using photos or drawings, the teacher may choose to have learners reproduce the Data Log on a sheet of chart paper to give them more room for recording.)
- Explain, Each team has a different question they want answered, therefore the data each team collects will be different. Use the blank Team Data Log to guide your discussions, but do not enter any information until you have decided as a team on what you will do.
- Take time now to consider your question and discuss what kind of information your team needs to answer the question and how the team will collect the information.
- Teams must consider if their information will include measurements. If so, what kind, and how will they measure? If the information comes from observation only, how will they record that? (With pictures, drawings, etc.)
- Will collecting the information require available materials or equipment? If so, what? (Hand lenses, measuring tapes, etc.)
- Next, you must decide on the variable for your investigation. What will change and what will stay the same?
- The last thing you will do is make a prediction. What do you predict will happen in your investigation? Let learners know they should discuss ideas together and decide as a team what their prediction will be.
- After decisions are made about what information they need to collect, learners can record their information on the Team Data Log. Explain that they must list any tools they need on their data logs today so that you can get them ready for use in the next class period.
- As teams discuss, move between them to offer guidance as needed. This part of planning the investigation is important and will be different for all teams because their questions may be different. Guidance should be offered in the form of open questions (e.g., What will you look for? How will you know . . . ?).
Explain
- When time is up, ask the Data Scientists from each team to explain what kind of information the team is going to collect, how the team will collect it, and what variable the team will change in its investigation.
- Let them know that they will make daily observations from Day 6 of this unit through Day 13 and that they will need to record information on their Team Data Log every day. The Data Scientist should the record the information on the chart.
- Remind the teams that their answers will be different depending on what they are investigating. Assure them that you will offer guidance if needed. (Note: if teams decide to use photos, the teacher may modify how they document the data.)
- At the end of class, collect the Team Data Logs so that the teacher can gather the materials teams have requested for the next class.
Elaborate
- Remind learners that the data they collect will be used as evidence that supports their answers or explanations at the end of the investigation.
- Let them know that at the end of the investigations, they will all have a chance to present their findings at a special in-class science meeting.
Evaluate
- Did learners demonstrate an understanding of the kind of information they need to collect?
- Did they formulate a reasonable plan for how they will collect information?
- Are they using science language in their science notebooks as part of their reflections or notes?
-
Expanded Standards
Reading TEKS:
ELA.3.9F: Listening, speaking, reading, writing, and thinking using multiple texts—genres. The student recognizes and analyzes genre-specific characteristics, structures, and purposes within and across increasingly complex traditional, contemporary, classical, and diverse texts. The student is expected to: (F) recognize characteristics of multimodal and digital texts.
NGSS:
3-LS2-1: Science and Engineering Practices: construct an argument with evidence, data, and/or a model.
CCSS:
W.3.7: conduct short research projects that build knowledge about a topic.
Science TEKS:
2018–19: 3.2A: plan and implement descriptive investigations, including asking and answering questions, making inferences, and selecting and using equipment or technology needed, to solve a specific problem in the natural world.
2024–25: 3.1A: ask scientific questions and define engineering problems based on observations or information from text, phenomena, models, or investigations.